
La documentation est disponible en anglais.
Documentation / Agentic graph
Flagship
Agentic graph
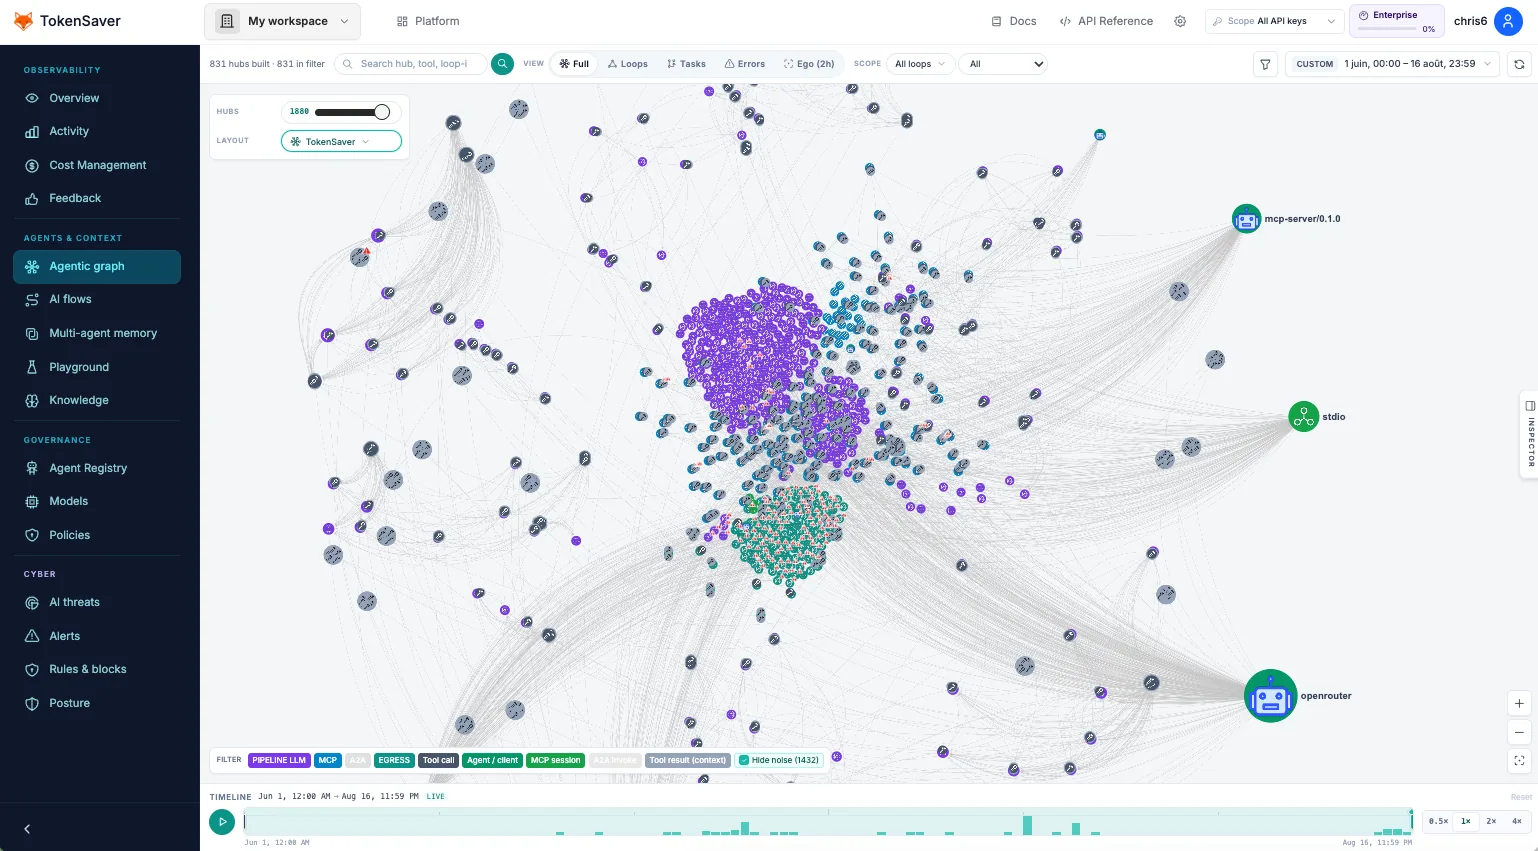
TokenSaver’s flagship observability surface: a live cartography of every governed run — pipeline, MCP, LLM egress, and A2A — so teams can see how agents actually behaved, not only that a request succeeded.
Traditional dashboards answer “how many tokens?”. The agentic graph answers “what called what?” — which tools fanned out from a hub, which loops clustered work, which turn chain led to an error. That is why we put it first in Docs.
- CLI / SDK / egress / MCP
- Governed pipeline + audit
- Observability stores
- Sigma agentic graph
What you can explore next
- Nodes & layers — hubs, tools, Complet / Boucles / Tâches / Ego
- How to read a flow — Flux IA deep-link into the graph
- Loops & tasks — iterative work and turn chains
- Console tour — where to click in the product