
Docs / Agentic graph
How to read a flow
Start from Flux IA for a searchable table, then jump into the graph for structure — or open the graph first and select a hub.
Analysts usually begin in Flux IA (filters, sensitive-only, protocol). Architects and security reviewers often start on the graph to see fan-out. Both share the same period and API key filters from the monitoring header.
- Open Flux IA Monitoring → Flux IA. Pick period and optional API key. Find the run of interest.
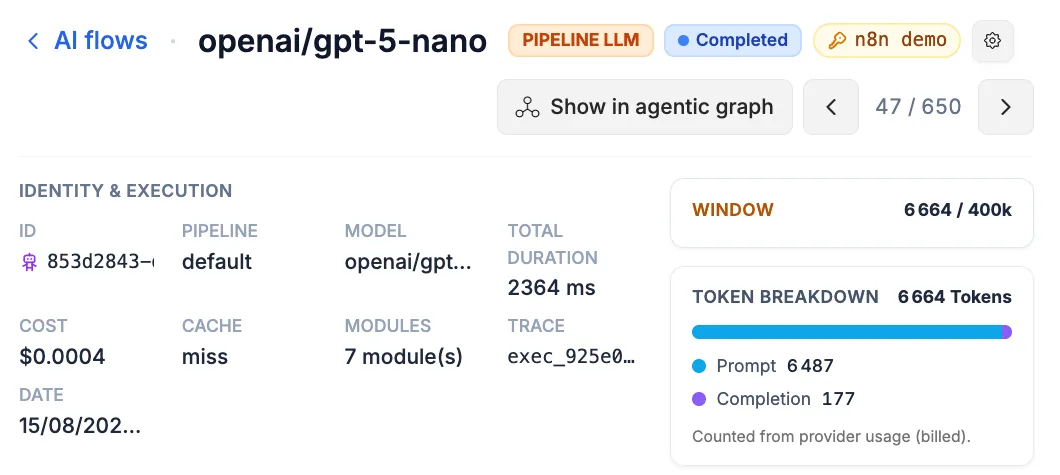
- Open run detail Click the row. Review modules, tokens, and errors in the detail panel.
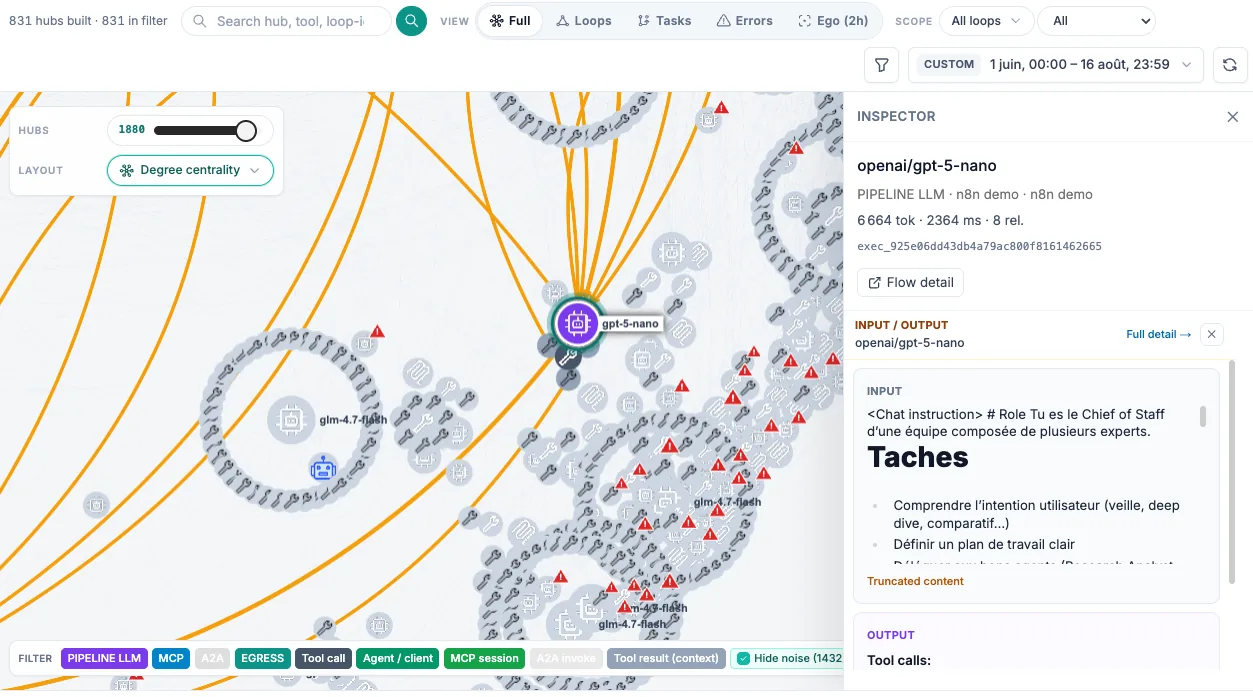
- Show in agentic graph Click « Voir dans le graphe agentique ». The canvas focuses that hub (animated once per deep-link).
- Expand & inspect Expand tools, open the inspector, switch to Ego or Tasks if you need a tighter view.
- Flux IA row
- Run detail
- Show in graph
- Focused hub + inspector
Period filters align with Flux IA & metrics.