
Docs / Core concepts
Flux IA & metrics
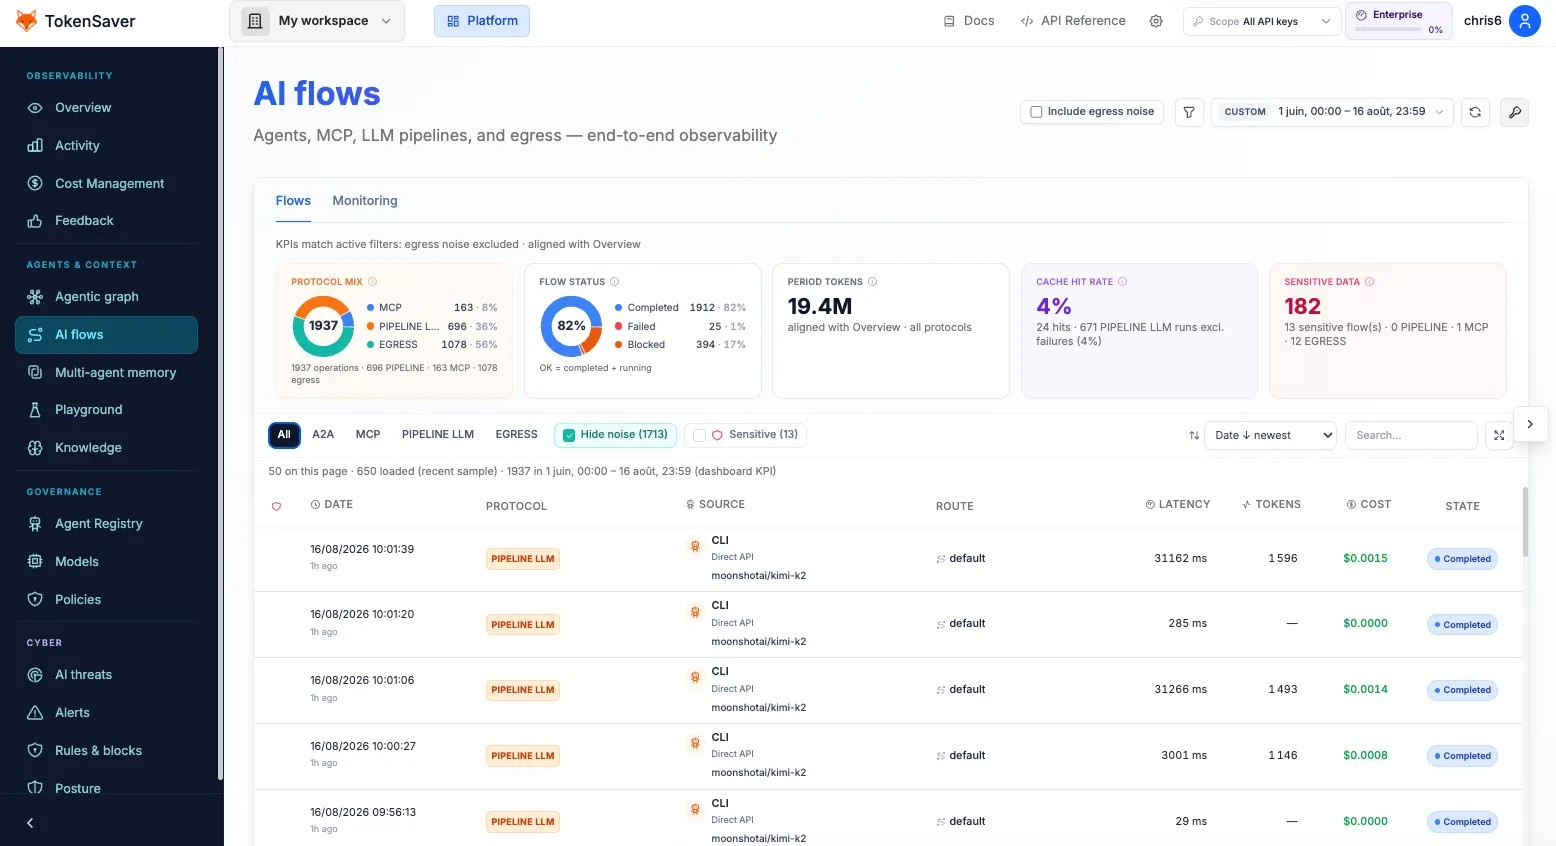
Monitoring dashboard: overview KPIs, Flux IA table, Cost Management, and the agentic graph — one period filter to rule them all.
Observability is not an afterthought: it is how you prove policies ran, how you debug agent fan-out, and how finance sees savings from cache.
- Overview KPIs
- Flux IA table
- Agentic graph
- Cost Management
Deep dive the agentic graph when structure matters more than a single row.